 Devroniq Studio
Start a project
Tidemark.
Business intelligence for a growing supplier: the numbers an owner, a finance lead and an operations manager each need — in one place, and all agreeing with each other.
An original studio project — designed and built by Devroniq Studio to show what we can make. Not client work.
The problem
Most growing businesses have the numbers. What they lack is one version of them.
Sales sit in one system, costs in another and stock in a spreadsheet, so every meeting starts by arguing about which figure is right. Tidemark imagines a fictional supplier, Fernway Supply Co., and shows what a coherent BI product looks like: one set of filters, one dataset, and every view reconciling with the others.
What it does
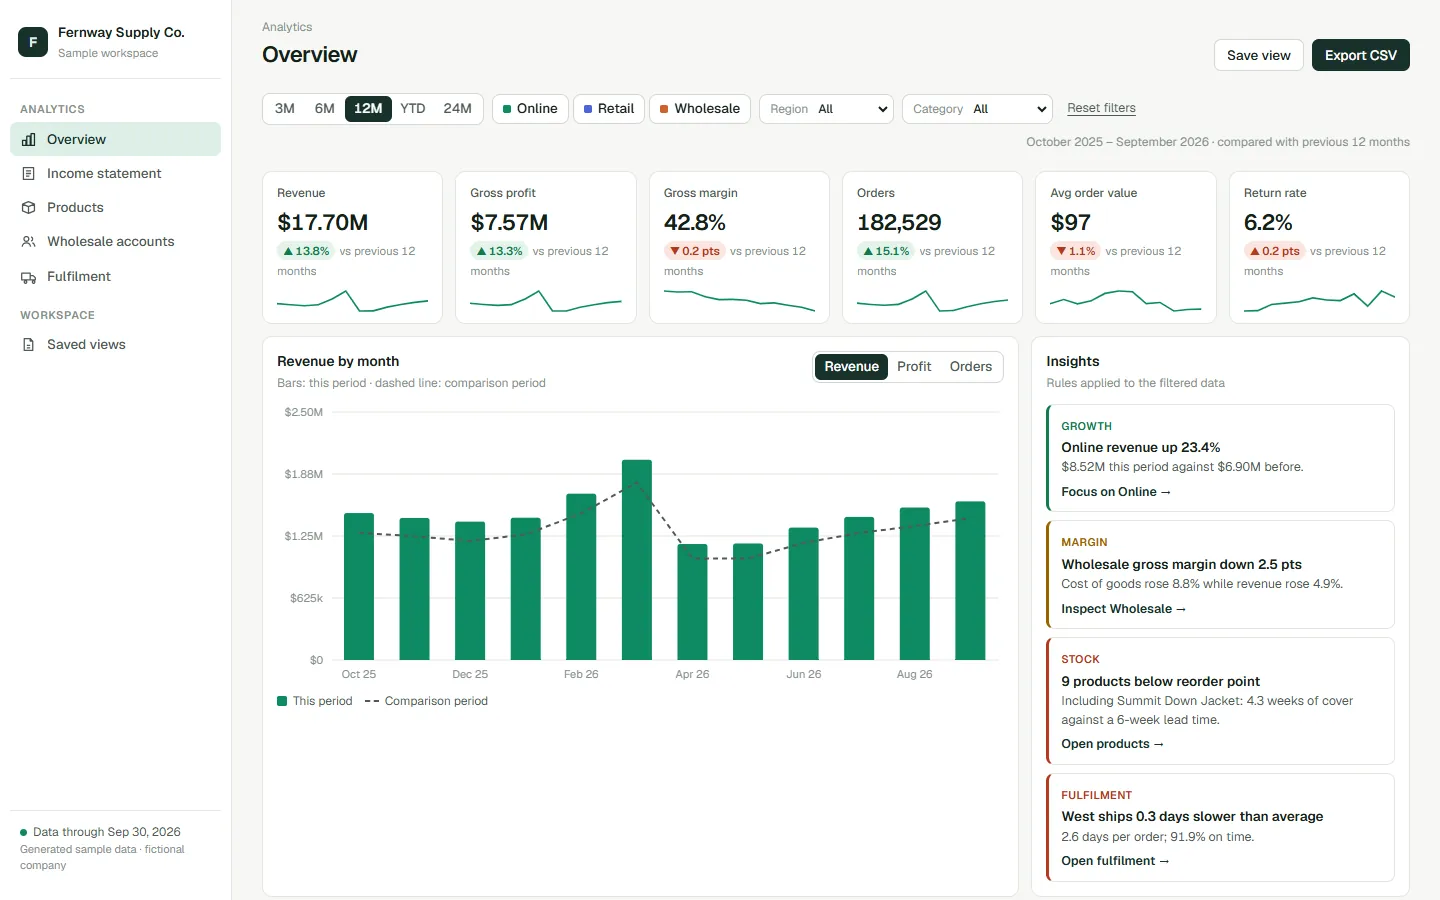
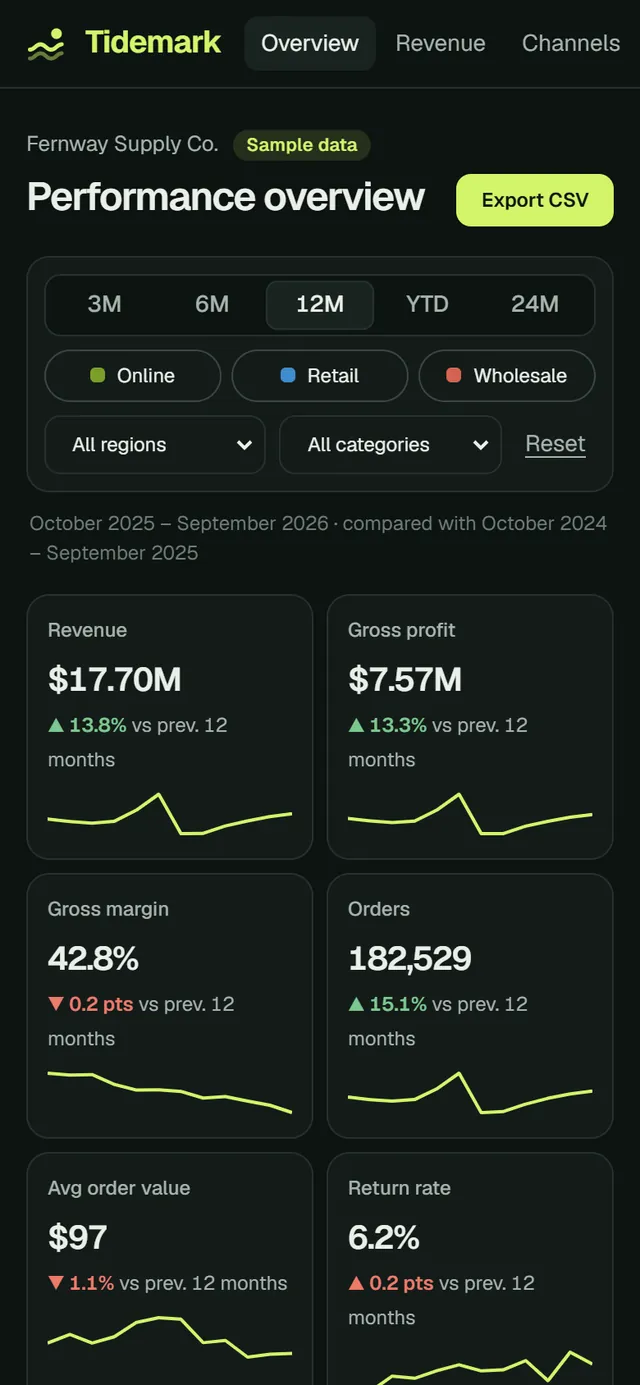
- OverviewSix KPIs against the right comparison period, a monthly chart with the prior period overlaid, channel and region breakdowns.
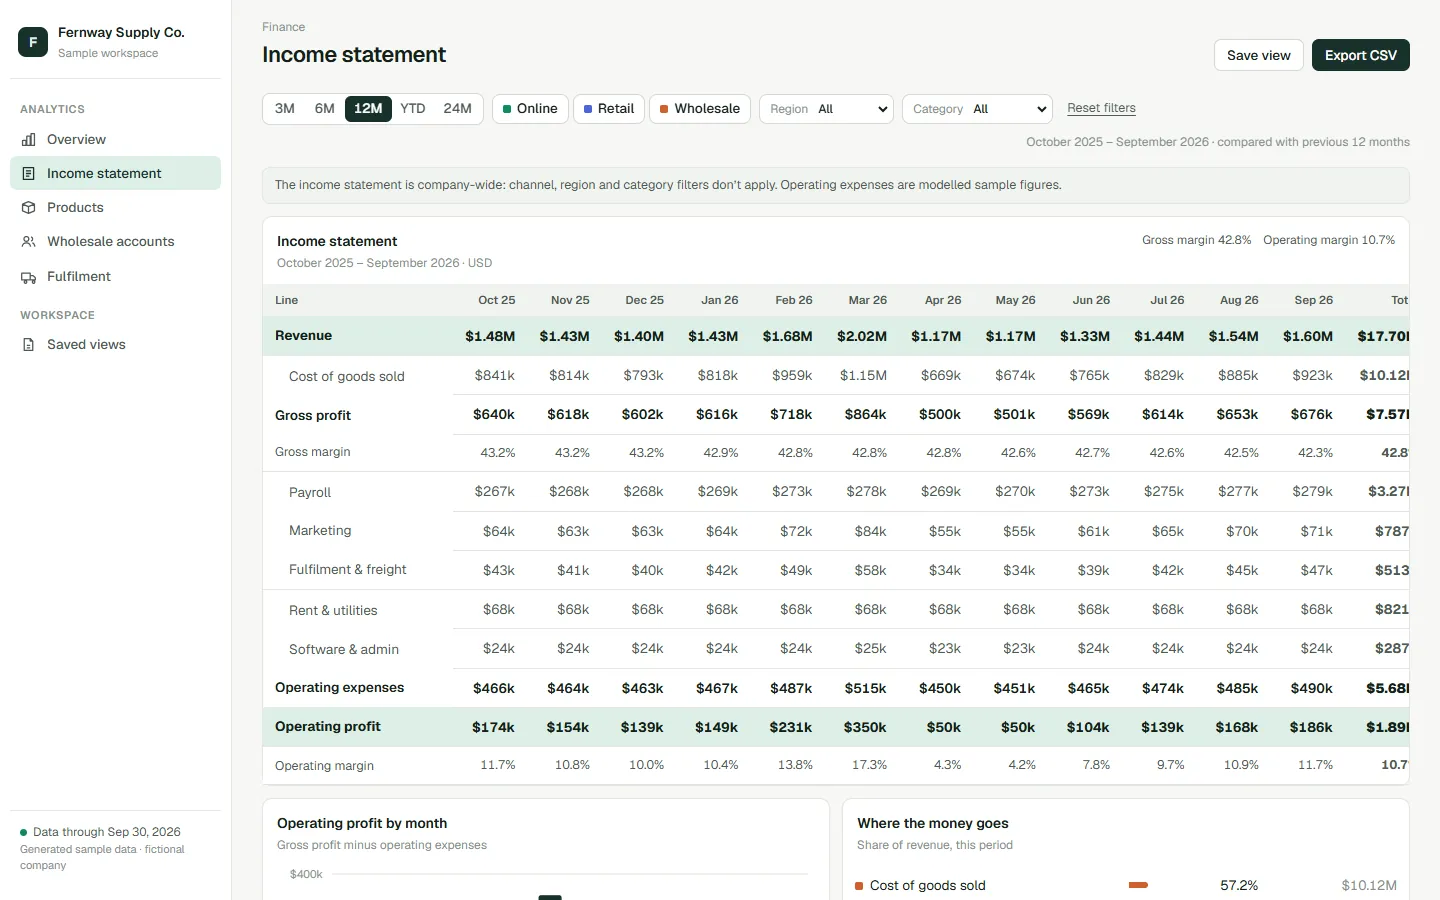
- Income statementRevenue through gross profit, five operating-expense lines and operating profit, by month with totals and change.
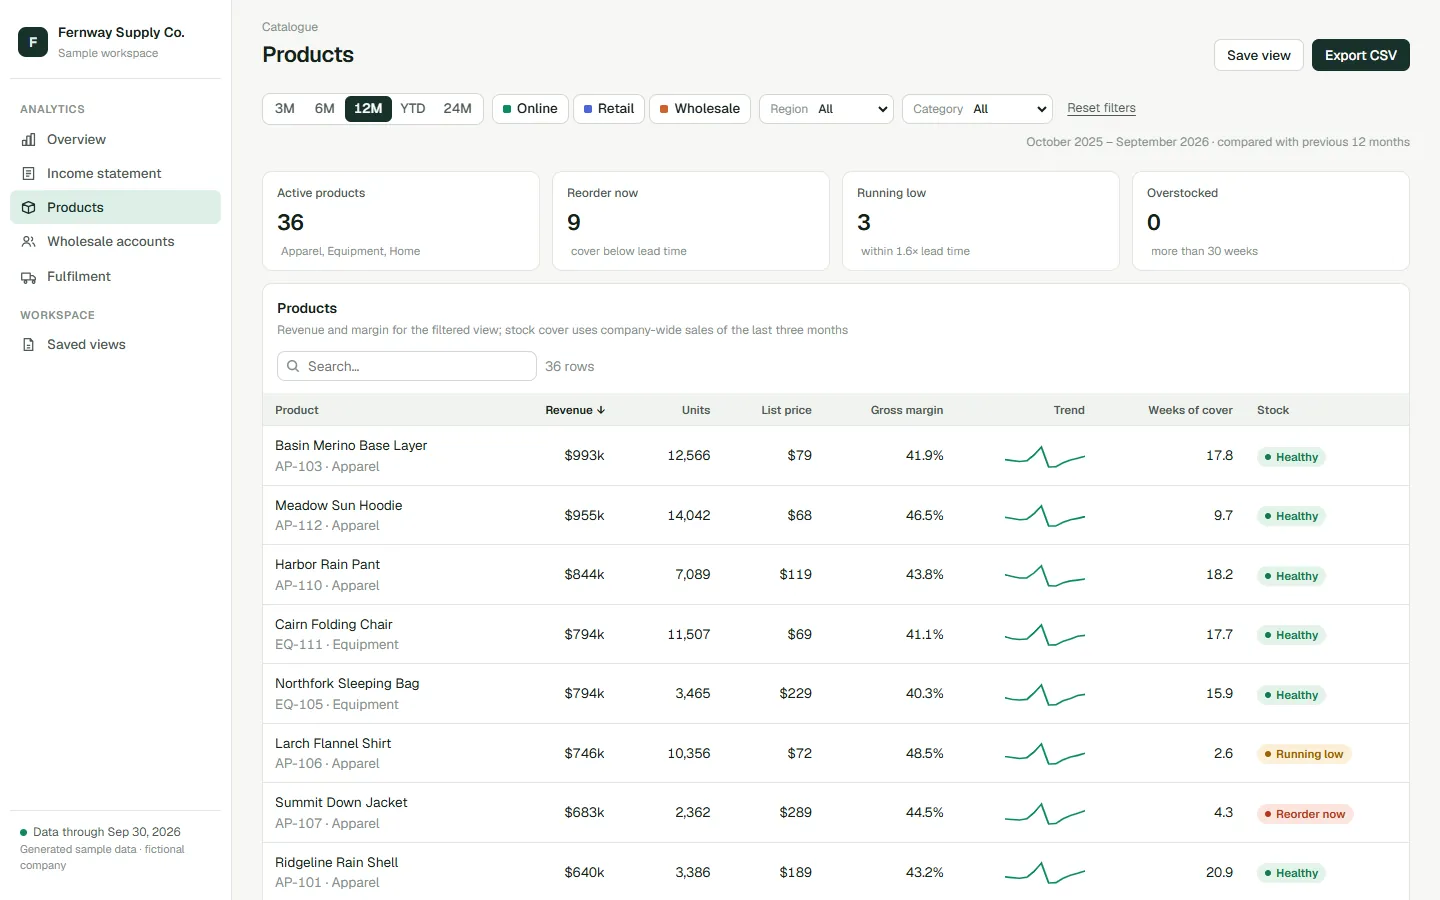
- Products36 SKUs with revenue, units, margin, trend and weeks of cover — and a detail drawer for each.
- Wholesale accountsRevenue, order size, payment terms, days to pay and receivables, with collection status.
- FulfilmentDays to ship, on-time delivery against target and returns by region and channel.
- Saved views and exportSave any combination of view and filters; export every table to CSV.
Design decisions
Light, dense and calm — set in Geist with tabular figures, so long tables stay readable. Chart colours were tested for colour-blind separation, statuses always carry a label, and the comparison period is a dashed line on the same axis rather than a second scale.
The states between screens were designed too: loading skeletons, empty results with a way out, notices when a filter doesn’t apply, and an explicit message when the browser blocks saved views.
Try it here.
Open full screenHonest notes
- Vanilla JavaScript modules
- Hand-drawn SVG charts
- Deterministic sample dataset
- localStorage for saved views
- Geist (open-source)